When people see a low PageSpeed Insights score, they often ask the wrong question first.
They ask: “Is this bad for SEO?”
That question matters, but it is not the best starting point.
The better question is: “What is the user actually experiencing?”
Core Web Vitals are not just technical numbers. They are Google’s way of measuring whether a page loads quickly, responds smoothly, and stays visually stable for real users.
I’m Matteo Arellano , and I work on technical SEO, analytics, and organic growth systems. For me, Core Web Vitals are interesting because they sit between SEO, engineering, user experience, and business performance. They force us to ask whether a page is not only indexable, but actually usable.
The case: a public PageSpeed Insights test
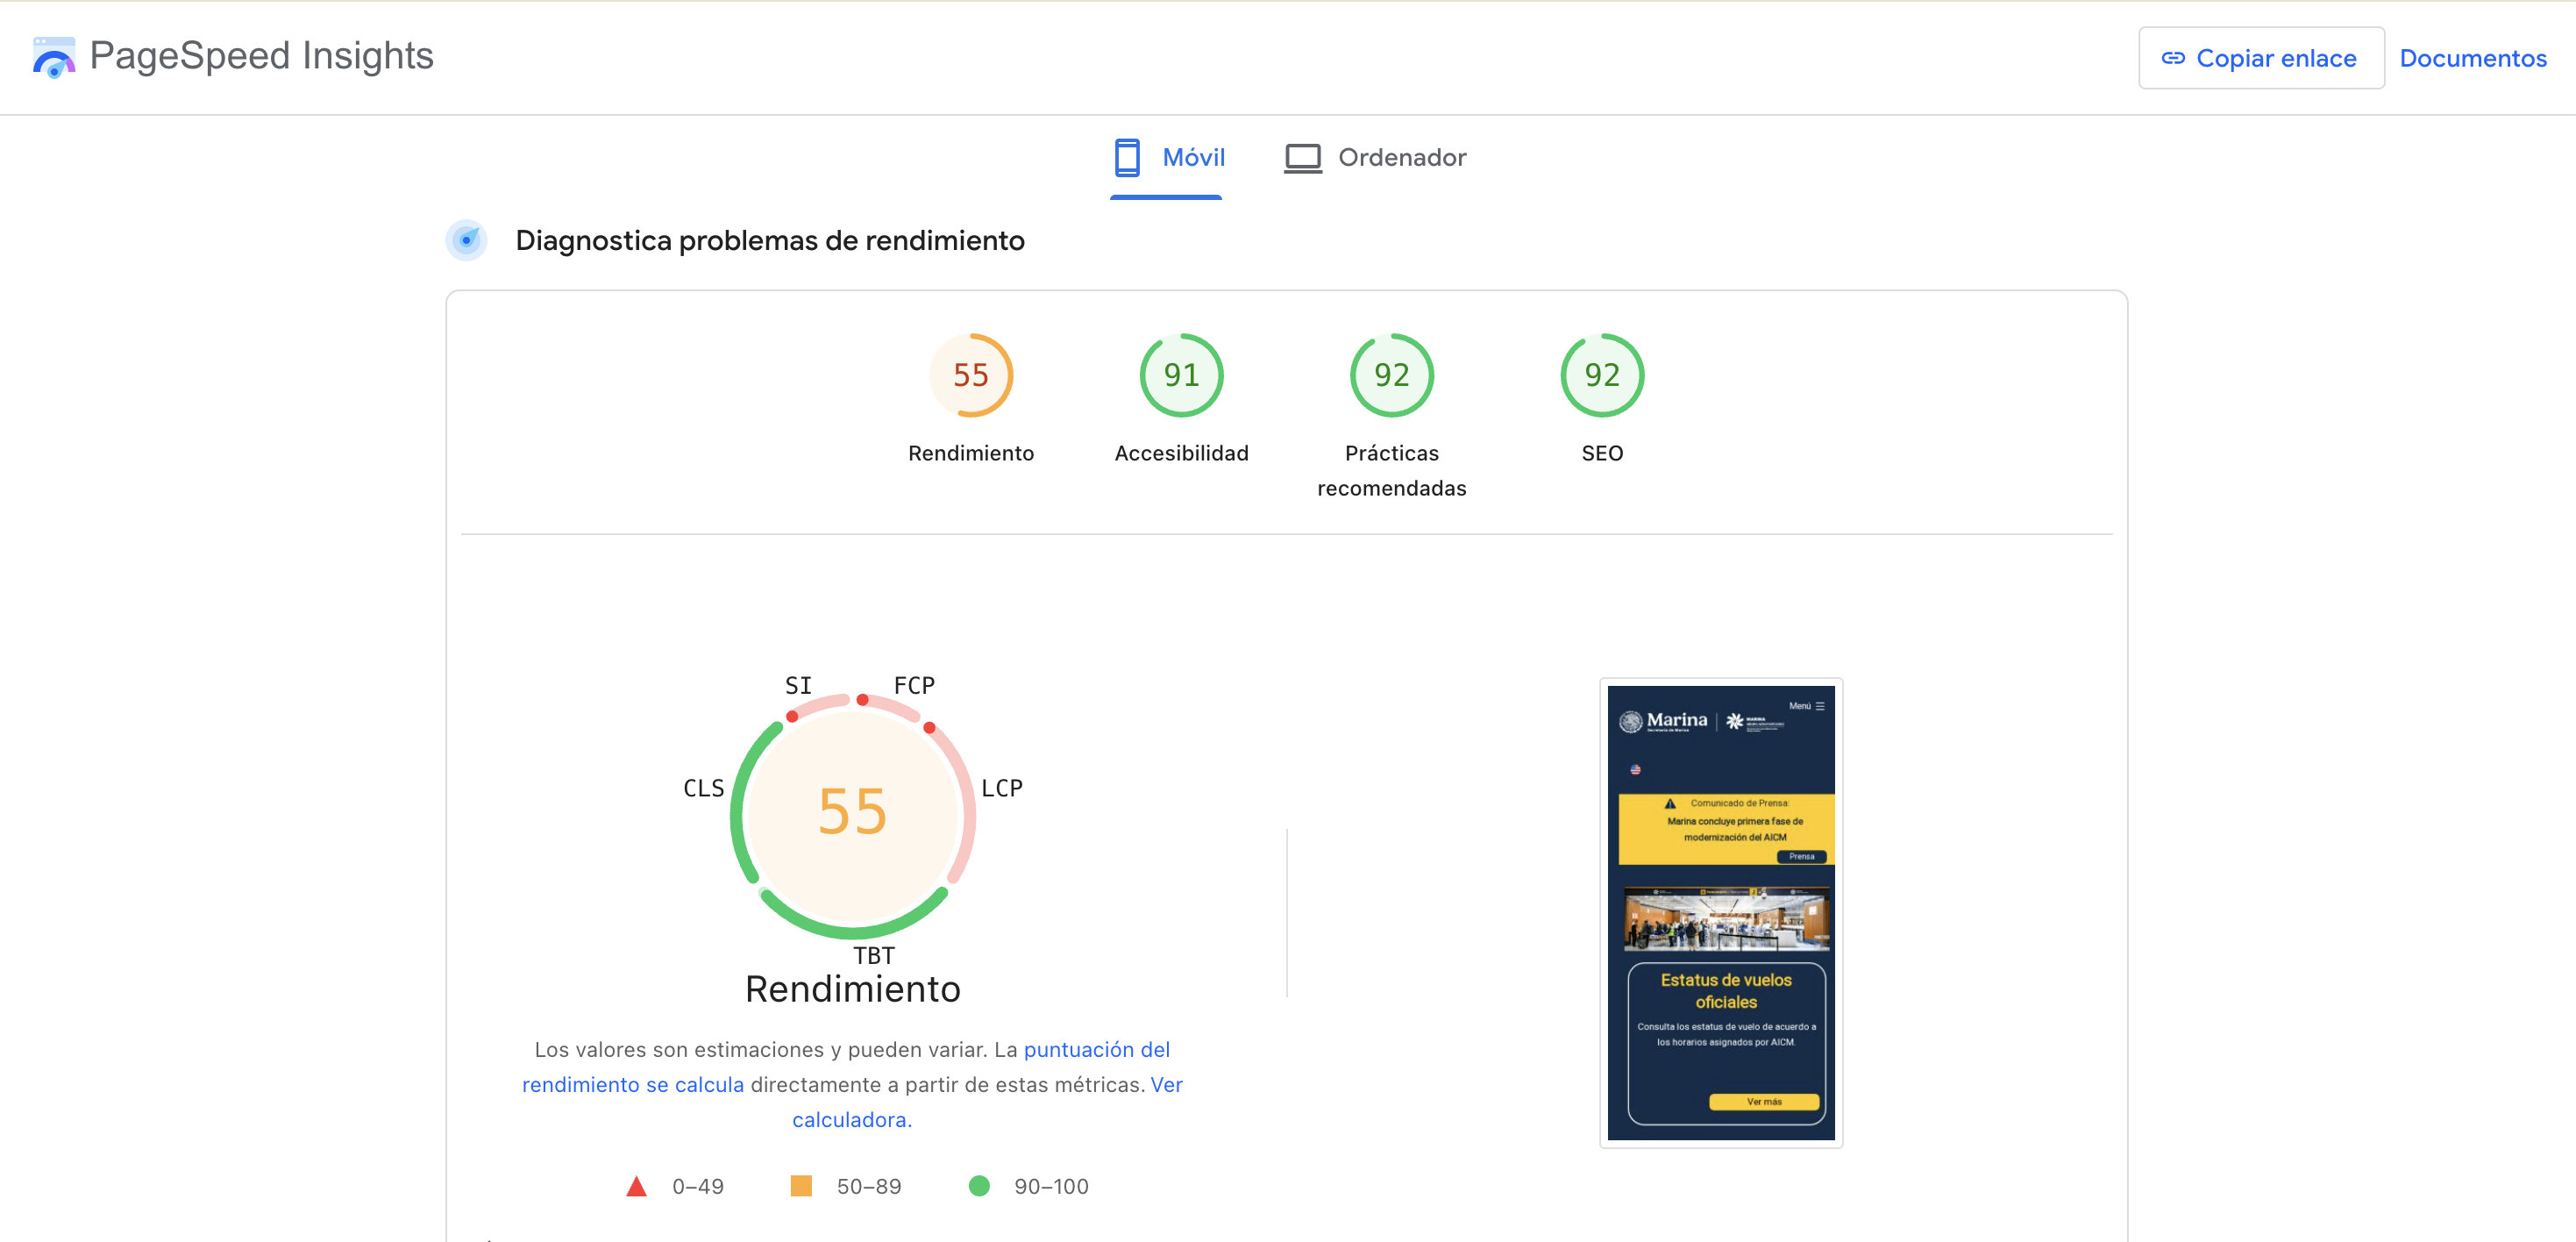
For this example, I reviewed a public mobile PageSpeed Insights report for the Mexico City Airport website and I found specific items where it could be improved. In this article, I'll share a a practical technical SEO case study showing how I would read a performance report, explain the issues, and turn the data into developer-ready priorities.
The mobile PageSpeed report shows a performance score of 55. At the same time, the page scores well in other areas: accessibility, best practices, and basic SEO checks are all above 90.
This distinction matters. A page can pass many basic SEO checks and still offer a weak mobile loading experience.
| Area | Reported score | What it means |
|---|---|---|
| Performance | 55 | The page is slow in the lab test and needs technical performance work. |
| Accessibility | 91 | The page performs relatively well on automated accessibility checks. |
| Best practices | 92 | The page passes many general browser and security checks. |
| SEO | 92 | The page passes basic crawlability and HTML SEO checks, but this does not mean performance is good. |
What are Core Web Vitals?
Core Web Vitals are three Google metrics focused on user experience.
LCP
Largest Contentful Paint measures how long it takes for the largest visible content element to appear. This is usually the main image, hero section, heading block, or large visible content area.
INP
Interaction to Next Paint measures responsiveness. In simple terms, after a user taps, clicks, or types, how long does the page take to respond visually?
CLS
Cumulative Layout Shift measures visual stability. It checks whether content unexpectedly jumps around while the page loads.
Google’s recommended thresholds are LCP under 2.5 seconds, INP under 200 milliseconds, and CLS under 0.1.
In simple terms:
- LCP asks: “Did the main content appear quickly?”
- INP asks: “Did the page respond quickly when the user interacted?”
- CLS asks: “Did the page stay visually stable?”
Field data vs lab data
PageSpeed Insights has two types of data, and they should not be confused.
Field data comes from real users. It tells us how people actually experienced the page in Chrome over the last 28 days, when enough data is available.
Lab data comes from a controlled Lighthouse test. It simulates a page load on a specific device and network setup. Lab data is useful for debugging because you can run it immediately, but it may not match every real user experience.
For an audit, I use both. Field data tells me whether users are affected. Lab data helps me find the likely technical causes.
What the report shows
The real-user data shows that the page does not pass the Core Web Vitals assessment. The main issue is LCP.
| Metric | Observed value | Good threshold | Diagnosis |
|---|---|---|---|
| LCP | 5.7 seconds | Under 2.5 seconds | Main visible content appears too late for many mobile users. |
| INP | 92 milliseconds | Under 200 milliseconds | Responsiveness looks good in field data. |
| CLS | 0 | Under 0.1 | Visual stability looks good in field data. |
The lab test confirms the same pattern. The page is not mainly failing because of interaction or layout shift. The bigger issue is loading performance.
- First Contentful Paint: 6.6 seconds
- Largest Contentful Paint: 12.2 seconds
- Total Blocking Time: 110 milliseconds
- Cumulative Layout Shift: 0.008
- Speed Index: 22.9 seconds
So the diagnosis is not: “This page is broken everywhere.”
The diagnosis is more specific: “The mobile page takes too long to show meaningful visible content.”
What does above the fold and below the fold mean?
“Above the fold” means the part of the page a user sees immediately before scrolling.
On mobile, this is the first screen. It usually includes the header, hero area, main image, headline, navigation, search box, or first call-to-action.
“Below the fold” means the part of the page the user only sees after scrolling. This can include lower images, additional sections, FAQs, footer content, related links, testimonials, or secondary content blocks.
This distinction matters for performance because above-the-fold content should load quickly. Below-the-fold content can often be delayed because the user may not need it immediately.
What is the hero area?
The hero area is the first large section users see when they open a page.
On many websites, it includes:
- The main headline
- A large banner image
- A carousel or slider
- A booking or search form
- A call-to-action button
- A background video or visual block
The hero area matters because it is often above the fold. If the hero area is slow, the whole page feels slow.
In this PageSpeed example, the LCP element is a large carousel image. That means the largest visible content is part of the hero area, and it is taking too long to appear.
What is lazy loading?
Lazy loading means delaying the loading of a resource until it is needed.
For images, this usually means the browser does not download the image until it is close to entering the user’s screen.
Lazy loading is usually useful for below-the-fold images because the user may never scroll far enough to see them. For example, footer images, gallery images, and lower-page illustrations can often be lazy-loaded.
But the main above-the-fold image should usually not be lazy-loaded.
Why? Because if the largest visible element is the hero image, and that image is lazy-loaded, the browser may delay downloading the exact image that defines the LCP score.
In simple terms:
- Lazy loading below-the-fold images is usually good.
- Lazy loading the main above-the-fold image can hurt LCP.
- The LCP image should be discovered early and loaded with high priority.
What does “compressed properly” mean?
Compression can mean two different things in a performance audit.
Image compression
Image compression means reducing the file size of an image while keeping acceptable visual quality.
A properly compressed image is not just “smaller.” It should be the right size, format, and quality level for where it appears.
For example, if a mobile screen displays an image at around 390 pixels wide, the browser should not need to download a huge desktop image that is 2000 pixels wide, unless there is a clear reason.
A properly compressed image should usually be:
- Resized to the dimensions actually needed.
- Exported at a reasonable quality level.
- Served in a modern format when possible.
- Delivered with responsive image markup such as srcset and sizes.
- Not heavier than necessary for the visual role it plays.
Text compression
Text compression applies to files such as HTML, CSS, and JavaScript.
These files should usually be compressed with Brotli or Gzip before they are sent from the server to the browser.
If a report says text compression is missing, that usually means the server or CDN is sending larger text files than necessary.
Why are WebP and AVIF useful?
WebP and AVIF are modern image formats.
They are useful because they can often deliver similar visual quality with smaller file sizes than older formats like JPEG or PNG.
Smaller image files help users because there is less data to download, especially on mobile networks.
This does not mean every image should blindly become AVIF. A practical setup is:
- Use AVIF where supported and where it produces a good result.
- Use WebP as a strong fallback.
- Use JPEG or PNG only when needed.
- Use responsive images so mobile users do not download desktop-sized assets.
In this case, the LCP image appears as a large PNG. A developer should test whether converting it to WebP or AVIF, resizing it for mobile, and loading it earlier would reduce the LCP delay.
The first technical problem: render-blocking requests
The report flags render-blocking requests with an estimated saving of 6,700ms.
In simple terms, render-blocking resources are files that delay the browser from showing the page.
These are often CSS and JavaScript files.
The problem is not that CSS and JavaScript are bad. The problem is when too many non-critical files are loaded before the browser can show the important first screen.
How does a browser load a page?
To understand render-blocking and parser-blocking scripts, we need to understand how a browser loads a page.
- The browser requests the HTML document.
- The browser starts reading the HTML from top to bottom.
- As it reads, it builds the DOM, which is the structure of the page.
- When it finds CSS, it downloads and processes it because CSS affects how the page looks.
- When it finds a normal JavaScript file without async or defer, it may pause HTML parsing, download the script, execute it, and only then continue reading the HTML.
- The browser combines the page structure and CSS to render pixels on the screen.
- Images, fonts, scripts, and other resources continue loading.
- JavaScript may continue changing the page after the first render.
A parser-blocking script is a script that stops the browser from continuing to read the HTML until the script has been downloaded and executed.
In simple terms, the browser is trying to read the page. A parser-blocking script interrupts it and says: “Stop reading. Download me. Run me. Then continue.”
That can delay rendering, delay discovery of important resources, and make the page feel slower.
How can developers identify parser-blocking scripts?
Developers can start with PageSpeed Insights. If it reports render-blocking requests, review that list first.
Then open Chrome DevTools, go to the Network tab, reload the page, and inspect the request waterfall.
Look for:
- JavaScript files loaded early in the document.
- Scripts without async or defer.
- Long chains where one request delays another.
- CSS files that block rendering.
- Third-party scripts that start before the main content appears.
A classic parser-blocking script looks like this:
<script src="/example.js"></script>A less blocking version may look like this:
<script src="/example.js" defer></script>Or, for independent scripts where execution order is not important:
<script src="/example.js" async></script>This should not be changed blindly. Some scripts depend on order. Some plugins expect another library to exist first. Some scripts control visible components. Developers should test the page after changing script loading behavior.
A simple console script to inspect JavaScript size
There are ways to see the size of loaded scripts with a simple JavaScript snippet in the browser console.
Open Chrome DevTools, go to Console, and run:
console.table(
  performance
    .getEntriesByType("resource")
    .filter((resource) => resource.initiatorType === "script")
    .map((resource) => ({
      url: resource.name,
      origin: new URL(resource.name).origin,
      thirdParty: new URL(resource.name).origin !== location.origin,
      transferKB: Math.round(resource.transferSize / 1024),
      encodedKB: Math.round(resource.encodedBodySize / 1024),
      durationMS: Math.round(resource.duration),
    }))
    .sort((a, b) => b.transferKB - a.transferKB)
);
This helps identify which scripts are largest, which take longest, and which come from third-party origins.
You can do a similar check for CSS files:
console.table(
  performance
    .getEntriesByType("resource")
    .filter((resource) => resource.initiatorType === "link")
    .map((resource) => ({
      url: resource.name,
      origin: new URL(resource.name).origin,
      thirdParty: new URL(resource.name).origin !== location.origin,
      transferKB: Math.round(resource.transferSize / 1024),
      encodedKB: Math.round(resource.encodedBodySize / 1024),
      durationMS: Math.round(resource.duration),
    }))
    .sort((a, b) => b.transferKB - a.transferKB)
);
These snippets do not replace a full DevTools Performance audit. Some sizes may show as 0 because of caching, browser privacy rules, or missing timing headers from third-party resources. But they are a useful first look.
A simple console script to identify likely blocking scripts
Developers can also inspect the script tags on the page:
console.table(
  [...document.scripts].map((script, index) => ({
    index,
    src: script.src || "inline script",
    type: script.type || "classic",
    async: script.async,
    defer: script.defer,
    inHead: document.head.contains(script),
    likelyParserBlocking:
      document.head.contains(script) &&
      !script.async &&
      !script.defer &&
      (!script.type ||
        script.type === "text/javascript" ||
        script.type === "application/javascript"),
  }))
);
This does not prove the full performance impact by itself, but it helps identify scripts that deserve review.
The most suspicious scripts are usually in the head, not async, not defer, loaded before the main content, large or slow in the Network tab, and not required for the first screen.
What is a third-party resource?
A third-party resource is any file loaded from a domain that is not the website’s own domain.
For example, if the page is on:
www.example.comthen these could be third-party resources:
- fonts.googleapis.com
- fonts.gstatic.com
- cdnjs.cloudflare.com
- googletagmanager.com
- google-analytics.com
- youtube.com
- maps.googleapis.com
- facebook.net
- hotjar.com
- intercom.io
- stripe.com
Google Fonts is a third-party resource. A CDN library like cdnjs is also a third-party resource. Analytics scripts, tag managers, chat widgets, ad pixels, embedded videos, map embeds, review widgets, and payment widgets can also be third-party resources.
Third-party resources are not automatically bad. Many are useful and sometimes necessary. The risk is that they add extra DNS lookups, network connections, JavaScript execution, dependency chains, and code that the site owner does not fully control.
The performance question is not: “Can we remove every third-party script?”
The better question is: “Which third-party resources are essential, which can be delayed, and which are loading too early?”
What does reducing theme and plugin bloat mean?
“Theme and plugin bloat” sounds vague, so it needs to be translated into specific work.
On CMS websites, especially WordPress, themes and plugins often load CSS and JavaScript globally. That means files may load on every page even when the page does not actually use that feature.
For example:
- A table plugin may load CSS and JavaScript on the homepage even if there is no table.
- A video plugin may load styles on pages without videos.
- A slider plugin may load multiple scripts for a single carousel.
- A form plugin may load assets sitewide even when no form appears above the fold.
- A theme may load a large stylesheet even if only a small part is needed for the first screen.
- Legacy libraries may load even if the site no longer needs them.
Reducing bloat means auditing what is loaded and asking:
Is this file needed on this page, at this moment, before the first screen renders?
In practice, this can mean deactivating unused plugins, loading plugin assets only on pages where they are needed, removing duplicate CSS files, replacing heavy slider libraries, deferring non-critical JavaScript, splitting CSS by template, and removing unused theme features.
The goal is not to remove functionality. The goal is to stop making every visitor download code that is not needed for their current task.
The second technical problem: the LCP image
The report identifies the LCP element as a carousel image.
When the LCP element is an image, developers should check:
- Is the image larger than needed for mobile?
- Is it served in WebP or AVIF?
- Is the image compressed properly?
- Is it lazy-loaded even though it is above the fold?
- Is the browser discovering the image early enough?
- Does it have explicit width and height?
- Should it use fetchpriority="high"?
A practical fix could be to serve a smaller mobile-specific version of the image, convert it to WebP or AVIF, make it directly discoverable in the HTML, avoid lazy-loading it, and consider fetchpriority="high" if it is the main above-the-fold image.
If the carousel plugin delays the image, the team should consider whether the mobile hero really needs a carousel. A simpler static hero image may perform better.
The third technical problem: the network dependency chain
The report shows a long network dependency tree.
This means the browser has to load many resources before the page becomes visually complete. Long chains are especially expensive on mobile networks.
A dependency audit should ask:
- Which resources are loaded in the head?
- Which scripts are parser-blocking?
- Which CSS files are critical?
- Which plugin files can be delayed?
- Which third-party resources can be deferred?
- Which files are loaded globally but only needed on specific components?
Why the SEO score can be high while performance is poor
A common confusion is seeing an SEO score above 90 while performance is much lower.
The Lighthouse SEO score checks a limited set of technical basics. It does not mean the page has strong organic performance, strong content, strong rankings, or good Core Web Vitals.
In this case, the page can score well on basic SEO checks and still fail the Core Web Vitals assessment because the main problem is loading performance.
Are Core Web Vitals ranking factors?
Yes, Core Web Vitals are used by Google’s ranking systems, but this should be understood carefully.
Core Web Vitals are not a magic ranking lever. A fast page with weak content will not automatically outrank a slower page that answers the query better.
The real SEO impact is more nuanced.
Core Web Vitals matter because they contribute to page experience. If two pages are similar in relevance and quality, the page with the better experience may be more competitive.
So the risk is not: “Your rankings will instantly disappear because the performance score is 55.”
The real risk is: “Users may abandon the page earlier, Google may see weaker page experience, and the site may become less competitive when similar pages offer a faster and smoother experience.”
Real risk vs potential risk
Real user risk
If the page takes too long to show meaningful content, users may lose patience, especially on mobile devices and slower connections.
Conversion risk
Slow pages can make booking, searching, reading, or completing a task feel harder. Even if rankings do not change immediately, user behavior can suffer.
SEO competitiveness risk
Core Web Vitals are not the only ranking factor, but poor page experience can make a page less competitive when other pages satisfy the same intent with a better experience.
Operational risk
Performance issues often come from accumulated technical debt: old plugins, global CSS, heavy sliders, large images, and third-party scripts loaded too early.
What I would fix first
If I were auditing this page, I would not begin with a generic “make the site faster” recommendation. I would prioritize the largest bottlenecks.
1. Identify and optimize the LCP element
The report points to the carousel image as the LCP element. Compress it, resize it for mobile, serve it in a modern format, and make sure it is discovered early.
2. Reduce render-blocking CSS and JavaScript
Audit which files are critical for the first screen and which can be deferred, delayed, removed, or loaded only on specific pages.
3. Review the slider and plugin stack
If the carousel is mainly decorative, it may not justify the performance cost on mobile.
4. Enable text compression
Check whether Brotli or Gzip is enabled for HTML, CSS, and JavaScript files.
5. Clean the critical request chain
Make the most important resources load first, and delay resources that are not needed for the first screen.
6. Measure again after release
Test with PageSpeed Insights and Chrome DevTools after deployment, then monitor Search Console because field data takes time to refresh.
What business owners should understand
The goal is not a perfect Lighthouse score.
A perfect 100 is not always realistic, especially on complex websites with booking flows, third-party scripts, maps, payment systems, personalization, analytics, or CMS plugins.
The goal is to remove avoidable friction.
If users are waiting more than five seconds for the main content to load, that is not just a technical detail. It affects trust, task completion, conversion, and competitiveness.
How I can help
I help businesses turn technical performance reports into practical SEO and development priorities.
A PageSpeed Insights report can be overwhelming because it contains many warnings. The real value is knowing which ones matter, which ones affect users, which ones affect Core Web Vitals, and which ones developers should fix first.
In a technical visibility audit, I can help identify:
- Which templates or pages are affected.
- Which Core Web Vital is the main problem.
- What the LCP element is.
- Which scripts and styles are blocking rendering.
- Whether images, fonts, sliders, or plugins are delaying the page.
- Which third-party resources are essential and which can be delayed.
- Which fixes are likely to have the highest impact.
- How to translate PageSpeed findings into a developer-ready roadmap.
This is not about chasing a perfect score. It is about making the page easier to load, easier to use, easier to measure, and easier to compete with in search.
Need help prioritizing Core Web Vitals fixes?
I can review your PageSpeed Insights and Search Console data, identify the highest-priority performance issues, and turn the findings into clear technical actions for your website or development team.
Request a technical visibility checkThis is not about promising perfect scores. It is about finding the performance issues that matter most for users, search visibility, and conversion.
Sources and further reading
- Google Search Central: Understanding Core Web Vitals and Google Search results
- Google Developers: About PageSpeed Insights
- web.dev: Web Vitals
- web.dev: Understanding the critical path
- web.dev: Optimize resource loading with the Fetch Priority API
- MDN: Lazy loading
- Chrome Developers: Serve images in next-gen formats
- Chrome DevTools: Find unused JavaScript and CSS with the Coverage tool